
As noted in prior rants, I don’t trust the numbers and to challenge them naturally triggers a strong reaction. Once the mass-mind set, it resists anything that questions its integrity. Just today the President, citing Dr. S. A. Fauci, estimated that 100,000 to 240,000 Americans may die when the same Dr. Fauci, wrote in an editorial published online in the New England Journal of Medicine titled, “Covid-19 — Navigating the Uncharted:
“If one assumes that the number of asymptomatic or minimally symptomatic cases is several times as high as the number of reported cases, the case fatality rate may be considerably less than 1%.” [bold added].
How do we make sense of these numbers, coming from the same top government source, that vary 10x or more? These twelve medical professionals, from around the world, don’t believe the numbers either.
The numbers? Are they reliable, and their context? How threatened is the average person, sitting in their apartments, with nothing to do except watch the screen for the next month or two? Of course, they have to keep scaring everyone, or they just might turn off the tube. Don’t forget, the show must go on. What would all the corporate and fully censored social-media platforms do if nobody tuned in? What then?
The Governor of California predicts 50% of the population will be infected with COVID-19, instead of the normal 5% to 20% of the U.S. population that get the flu, on average, each year. 200,000 is the average number of Americans hospitalized each year because of influenza-related complications. 8,200 to 20,000 is the number of people who die each year from flu-related causes in the U.S.
Can we trust the medical profession’s estimates, which are guesses, when that profession is the third leading cause of death in the United States?
“Based on an analysis of prior research, the Johns Hopkins study estimates that more than 250,000 Americans die each year from medical errors.”
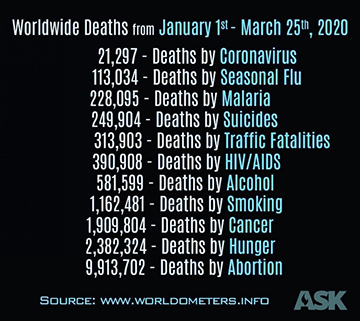
How reliable is that? Can we zoom out and grasp a global perspective, a view that gives us a context to appreciate just how threatened we really are? I keep returning to scale, in comparison with what we call normal.
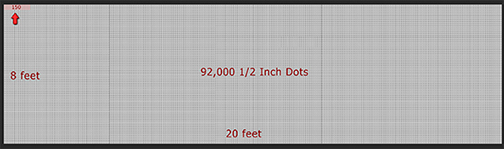
Just for fun, imagine that you have a large wall, twenty-feet long and eight-feet tall, and on that wall you placed ½ inch dots, filling the surface.
8ft (96”) x 20ft (240”) wall = 23,000 sq/in or 92,000 .5 sq/in
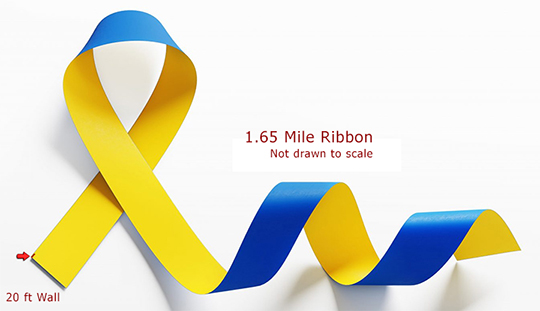
How many 8ft x 20ft walls would you need, with 92,000 dots on each, to equal the population of California, 39,937? 435 And that wall would stretch 1.65 miles.
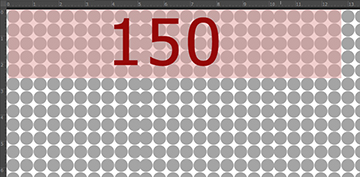
Total deaths attributed to COVID-19 in California, March 30th = 149
Using data from China and Italy, over 50% of those deaths involved patients with 1 to 3 preexisting chronic diseases; compromised immune systems, diabetes, heart disease, high blood pressure, and others. There is a very high probability that these deaths would occur with normal flu. Let’ accept, for now, the 150 dots.
Imagine 435 of these walls, 20ft long, standing together and streaking 1.65 miles long.

Using California deaths to date, the red dot below covers less than 13 x 2.5 inches of that 1.65-mile wall.
That, I believe, is how threatened the average person is. Does this mean we should not wash our hands?
Not at all.
Public health researchers, carefully reviewing the numbers, believe the actual infections and deaths are much less:
Fewer people may die from coronavirus than was previously thought, according to new research from a team of infectious disease experts.[i] The death rate from novel coronavirus, COVID-19, in Wuhan, China, where the virus is said to have originated, is about 1.4% — far lower than the 3.4% death rate (and even higher) reported by the World Health Organization.[ii]
What about the world? Here is where our ‘assumptions’ about viruses, how they spread and infect, get challenged. Infections in Japan, April 1st: 1,953 total cases, Tokyo, 430 cases, with a population of 13.932 million. Today, New York City, 43,139+ cases with a population of 8,398 million, which is a little more than half the population of Tokyo. If the contagious power of the virus is the same, why such dramatic differences in two of the most densely populated cities in the world? It doesn’t add up.
The actual level of a threat compared to what is considered normal does not justify shutting down the lives and economies of the entire planet, nor the ‘fast-tracking,’ of ‘emergency measures,’ which means without careful review, discussion, health, and safety testing, or considering the invasion of privacy and civil liberties. It doesn’t make any sense, that is, unless you are a magician.
Recall, it was the false-flag anthrax scare, after 9/11, which itself may have been a false-flag, an inside job, that triggered the Orwellian Patriot Act, the invasion of Iraq and ‘endless wars.’ Remember all those weapons of mass destruction that the government made up, like a magician waving a flag or pointing to the Bogeyman with one hand and picking your pocket with the other.
Below are several publications that question the numbers and describe the ‘fast-tracking’ of global surveillance, 5G rollout, global forced vaccinations, and other drastic erosions of personal privacy, human rights and due process that are racing forward under the cover of ‘emergency measures.’ Fear is always the tool that controls, which brings us back to the reliability of the numbers. They are not.
M
- Two Plans to “Re-Open” the Country Include COVID-19 Tracking Via Cell Phones and Mass Vaccination Program
- Mercola – China’s Draconian Tracking Measures Head West
- Surveillance and 5G Fast-Tracked Under the Pretext of Fighting Coronavirus
- Dr. Fauci NEJM Editorial Suggests That COVID-19 Fatality Rates May Be 10x Lower Than Official Projections
- The Numbers Are Not That High
- Italy: 99% of their Coronavirus Fatalities Were Already Sick; Half Diagnosed with 3 or More Diseases
- Could unchecked government power be more dangerous than the threat of infectious disease?